HTML5 Canvas
由于项目需要,最近开始学习 canvas。第一个任务是绘制一个雷达扫描的效果,在此整理一下思路和 canvas 的一些知识点。
【什么是 Canvas】
canvas 是 HTML5 中新增一个标签,它可以使用脚本来绘制 2D 或者 3D 图形。而 SVG 和 VML 使用一个 XML 文档来描述绘图。SVG 绘图很容易编辑与生成,但功能明显要弱一些。`
canvas 可以完成动画、游戏、图表、图像处理等原来需要 Flash 完成的一些功能。
【雷达扫描如何实现】
效果图:
![]()
思路:
1 绘制雷达背景
通过 canvas 矩形和路径方法绘制背景、圆形以及直线
2 绘制扫描尾迹以及亮点儿
绘制多个连续的弧形,透明度渐进达到尾迹的效果;绘制过个圆环,通过透明度渐进达到发亮的效果
3 添加动画效果
使用 requestAnimationFrame 或者 setTimeOut 逐帧绘制
一、绘制雷达背景
雷达图的背景包括了几个基本元素:矩形、圆形、实线、虚线。
【坐标系】
canvas 的左上角为坐标原点 (0,0),Y轴向下。
首先需要一个指定高宽的画布:
<canvas id="myCanvas" width="300" height="300">您的浏览器暂不支持Canvas</canvas>
然后在 js 中获取一些基本信息。代码的第一行通过使用 document.getElementById() 方法来为 canvas 元素得到 DOM 对象。一旦有了元素对象,你可以通过使用它的 getContext() 方法来访问绘画上下文。【注意】获得的是 DOM 对象,而不是 Jquery 对象。
const c= document.getElementById("myCanvas");
// 获得CanvasRenderingContext2D接口对象
const ctx = c.getContext("2d");

// 画布的宽高
const cWidth = c.width;
const cHeight = c.height;
// 中心点
const centerX = c.width/2;
const centerY = c.height/2;
为背景填充上黑色:
ctx.fillStyle = "black";        // 默认黑色
ctx.fillRect(0,0,cWidth,cHeight);
用 fillStyle 设置填充色,使用 fillRect 绘制矩形,参数包括了初始坐标点以及矩形的高宽。
【路径】
canvas 中的基本图形只有矩形,其他的图形都要使用的 路径 去绘制。
定义一个绘制圆的函数:
let drawCircle = function (r, lineWidth=1, color="#090", x=centerX, y=centerY) {
	ctx.beginPath();                // 起始一条路径
	ctx.setLineDash([]);            // 设置当前的线段样式
	ctx.arc(x,y,r,0,2*Math.PI);     // 定义圆弧路径
	ctx.lineWidth = lineWidth;      // 定义线宽
	ctx.strokeStyle = color;        // 定义绘笔颜色
	ctx.stroke();                   // 绘制路径
}
圆的绘制使用到了 arc(),该方法可以创建弧/曲线。与绘制矩形不同的是,这里定义颜色的时候使用了 strokeStyle 而不是 fillStyle,原因是这次绘制的圆不用填充,所以要定义的是绘笔的颜色。路径和绘笔颜色都定义好了,最后要使用 stroke 方法将其绘制出来。
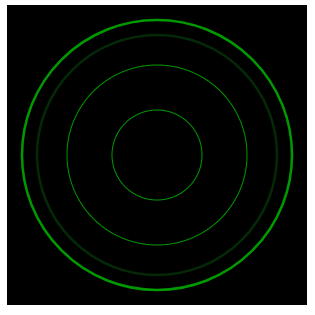
drawCircle(0.9*centerY, 2.5);
drawCircle(0.8*centerY, 2.5, "#042906");
drawCircle(0.6*centerY);
drawCircle(0.3*centerY);
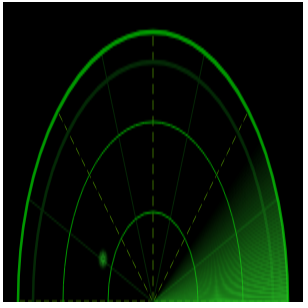
绘制后:
【线段】
定义一个线段绘制函数:
let Line = function (x, y, lineDash=[], color="#396a00", lineWidth=1) {
	ctx.beginPath();                // 起始一条路径
	ctx.setLineDash(lineDash);      // 设置当前的线段样式
	ctx.moveTo(centerX,centerY);    // 起点
	ctx.lineTo(x,y);                // 添加到新点的线段
	ctx.lineWidth = lineWidth;
	ctx.strokeStyle = color;
	ctx.stroke();
}
线段的绘制首先使用 moveTo() 把路径移动到了画布中的指定点。使用 lineTo() 添加一个新点,然后在画布中创建从该点到最后指定点的线条。setLineDash() 可以通过一个数组设置线段的样式,这个数组代表了线段和间距的长度,如果需要一条虚线,那么可以将其设置为 [5,5]。这样就完成了一条线段的绘制。
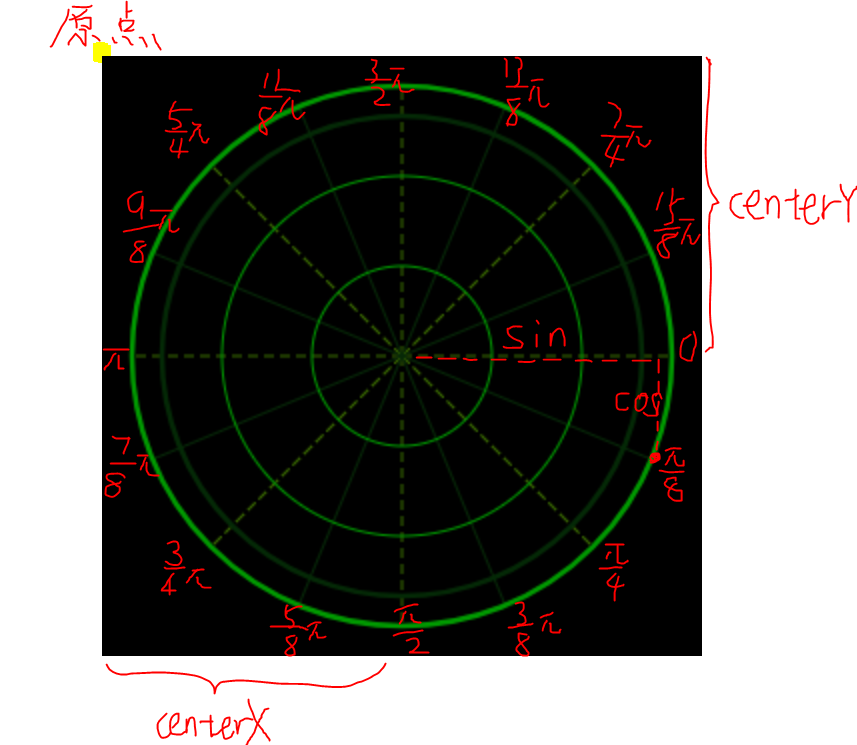
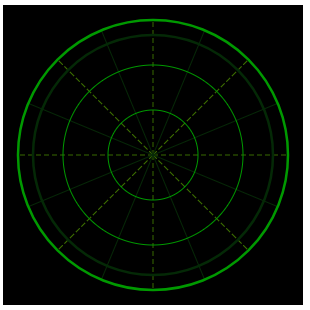
雷达图上的线都是以圆心为起点,终点在圆上,这里需要通过三角函数正确定位这些点的位置。圆形的三点钟位置是0°,每45°有一条虚线,两条实线之间有一条虚线,共16条。
// 虚线
for(let i = 1; i<=8; i++){
	Line(centerX + Math.sin(Math.PI*i/4)*radius,
		centerY + Math.cos(Math.PI*i/4)*radius,
		[5,3], "#396a00");
}
// 实线
for(let i = 1; i<=15;){
	Line(centerX + Math.sin(Math.PI*i/8)*radius,
		centerY + Math.cos(Math.PI*i/8)*radius,
		[], "#062807");
	i += 2;
}
二、绘制扫描尾迹及亮点
扫描的尾迹效果通过多个透明度渐进的扇形区域组成。
【有透明度的扇形】
通过 rgba 设置填充透明度
ctx.beginPath();
ctx.moveTo(centerX,centerY);
ctx.arc(centerX, centerY, radius, Math.PI/4, Math.PI/2);
ctx.fillStyle  = "rgba(42,195,39,0.5)";
ctx.fill();
为了达到尾迹扫过的效果,需要绘制多个角度很小的扇形,并使他们的透明度有规律的增加或减小,组成一个透明度渐变的大扇形。
let drawSector = function (sAngle, eAngle) {
    // 分割扇形块数
	let blob = 50;
	// 每块扇形夹角的度数
	let increase = 0;
    // 判断扇区是否跨越0度
	if(sAngle < eAngle) {
		increase =  (eAngle - sAngle)/blob;
	}
	else if(sAngle > eAngle) {
		increase = (Math.PI*2 - sAngle + eAngle)/blob;
	}
	else {
		return;
	}

	let angle1 = sAngle;
	let angle2 = sAngle + increase;

	// 从透明度最低的地方开始绘制扇形
	for(let i = 0; i < blob; i++){
		ctx.beginPath();
		ctx.moveTo(centerX,centerY);
		ctx.arc(centerX, centerY, radius, angle1, angle2);
		ctx.fillStyle  = "rgba(42,195,39,"+ i/blob +")";
		ctx.fill();
		angle1 = angle2;
		angle2 = angle1 + increase;
		// 当下个小扇区跨越0度时
		if(angle2 >= Math.PI*2){
		    // 填满当前角度到0度的区域
			ctx.beginPath();
			ctx.moveTo(centerX,centerY);
			ctx.arc(centerX, centerY, radius, angle1, Math.PI*2);
			ctx.fillStyle  = "rgba(42,195,39,"+ i/blob +")";
			ctx.fill();
			// 下一次从0度开始绘制
			angle1 = 0;
			angle2 = angle1 + increase;
		}
	}

}
将大扇区角度分为 blob,计算每个小扇区的角度 increase。另外每个小扇区的透明度为 i/blob。唯一需要注意的就是,当小扇区的角度跨域0°的时候,需要分开绘制。
【亮点儿】
亮点儿画法同理,绘制多个透明度的圆环,其中 n 决定了点的大小。
let drawPoint = function (x,y,n) {
		ctx.lineWidth = 1;
		for(let i = n; i > 0; i --){
			ctx.beginPath();
			ctx.arc(x,y,n-i,0,2*Math.PI);
			ctx.strokeStyle  = "rgba(42,195,39,"+ i/n +")";
			ctx.stroke();
		}
	};
三、动画效果
requestAnimationFrame是浏览器用于定时循环操作的一个接口,类似于 setTimeout,主要用途是按帧对网页进行重绘。requestAnimationFrame 的优势,在于充分利用显示器的刷新机制,比较节省系统资源。显示器有固定的刷新频率(60Hz或75Hz),也就是说,每秒最多只能重绘60次或75次,requestAnimationFrame的基本思想就是与这个刷新频率保持同步,利用这个刷新频率进行页面重绘。此外,使用这个API,一旦页面不处于浏览器的当前标签,就会自动停止刷新。这就节省了CPU、GPU和电力。
兼容性
window.requestAnimFrame = (function(){
      return  window.requestAnimationFrame       ||
              window.webkitRequestAnimationFrame ||
              window.mozRequestAnimationFrame    ||
              window.oRequestAnimationFrame      ||
              window.msRequestAnimationFrame     ||
              function( callback ){
                window.setTimeout(callback, 1000 / 60);
              };
    })();
使用方法
function repeatOften() {
  // Do whatever
  requestAnimationFrame(repeatOften);
}
requestAnimationFrame(repeatOften);
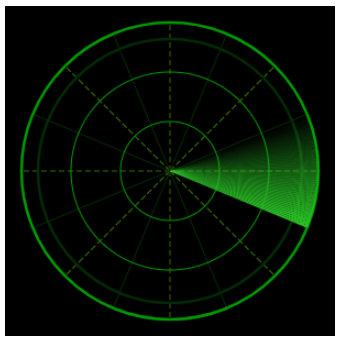
对于雷达扫描效果,repeatOften 函数中需要做的就是清除画布的内容,绘制雷达背景,绘制扇形以及点。其中扇形的角度和点的大小在改变。【请记住】画布只是一个像素缓冲区。如果你设置了一些像素,他们会留在那里,直到你改变它们。因此,在绘制矩形之前,请先使用 clearRect() 清除画布。
scan () {
	let scanBegin = 0;
	let scanEnd = Math.PI/4;
	let pointRadius = 1;
	// 绘制雷达扫描
	let move = function () {
		clear();		// 清除画布
		init();			// 重绘背景
		drawSector(scanBegin, scanEnd);		// 绘制扇形扫描区域
		drawPoint(cWidth/3, cHeight*3/7, pointRadius);	// 绘制发光点
		drawPoint(cWidth*4/5, cHeight*6/9, pointRadius);
		// 改变点的半径以及扇形的角度
		pointRadius += 0.08;
		scanBegin += Math.PI/64;
		scanEnd = scanBegin + Math.PI/4;
		// 超过阈值变为初始值
		if(scanBegin >= Math.PI*2) {
			scanBegin = 0;
			scanEnd = scanBegin + Math.PI/4;
		}
		if(pointRadius >= 6) pointRadius = 0;
		// 再次绘制
		window.requestAnimFrame(move);
	}

	window.requestAnimFrame = (function(){
	  return  window.requestAnimationFrame       ||
	          window.webkitRequestAnimationFrame ||
	          window.mozRequestAnimationFrame    ||
	          window.oRequestAnimationFrame      ||
	          window.msRequestAnimationFrame     ||
	          function( callback ){
	            window.setTimeout(callback, 1000 / 60);
	          };
	})();

	window.requestAnimFrame(move);
},
四、最后
将函数和变量整理到一个函数中
/**
 * 雷达图
 * @param  {string} canvas DOM id
 * @return {object}        雷达图对象
 */
function myCanvas(canvas){...}
使用
let radar = myCanvas("myCanvas");
if(radar)	radar.scan();
【补充】
五、关于 Canvas 的宽高
This is because a canvas actually has two sizes: the size of the element itself and the size of the element’s drawing surface.
Canvas 有两种大小,一种是元素本身,另外一种是元素绘图区。绘图区默认宽度为 300px 高度为 150px。
When you set the element’s width and height attributes, you set both the element’s size and the size of the element’s drawing surface; however, when you use CSS to size a canvas element, you set only the element’s size and not the drawing surface. When the canvas element’s size does not match the size of its drawing surface, the browser scales the drawing surface to fit the element.
使用 CSS 设置元素高宽的时候,绘图区的大小不改变。因此这样做会导致两种元素本身和绘图区大小不一致。这个时候浏览器就会对绘图区进行拉伸以适应元素本身大小。但是!在使用像 moveTo(0,0) 这样的函数时,坐标参数是以绘图区为准的。因此不推荐使用 CSS 来设置 Canvas 的大小。
推荐写法1: 直接在 HTML 中声明高宽
<canvas id="tutorial" width="500" height="500"></canvas>
推荐写法2: 在脚本中使用 DOM 属性更改高宽
var canvas = document.getElementById('tutorial');
canvas.width = 500;
canvas.width = 500;
不推荐:使用 CSS 设置高宽
#tutorial {
    width:500px;
    height:50px;
}
否则:
Canvas 与 SVG
【SVG】
SVG 是一种使用 XML 描述 2D 图形的语言。
SVG 基于 XML,这意味着 SVG DOM 中的每个元素都是可用的。您可以为某个元素附加 JavaScript 事件处理器。
在 SVG 中,每个被绘制的图形均被视为对象。如果 SVG 对象的属性发生变化,那么浏览器能够自动重现图形。
【Canvas】
Canvas 通过 JavaScript 来绘制 2D 图形。
Canvas 是逐像素进行渲染的。
在 canvas 中,一旦图形被绘制完成,它就不会继续得到浏览器的关注。如果其位置发生变化,那么整个场景也需要重新绘制,包括任何或许已被图形覆盖的对象。
对比 | Canvas | SVG | | ————————- | —————————— | | 依赖分辨率 | 不依赖分辨率 | | 不支持事件处理器 | 支持事件处理器 | | 弱的文本渲染能力 | 最适合带有大型渲染区域的应用程序(比如谷歌地图) | | 能够以 .png 或 .jpg 格式保存结果图像 | 复杂度高会减慢渲染速度(任何过度使用 DOM 的应用都不快) | | 最适合图像密集型的游戏,其中的许多对象会被频繁重绘 | 不适合游戏应用 |
参考链接:
MDN Canvas 教程 Canvas Deep Dive